

2007-2008: The Year of Extremes
The first year of the "analytics era" turned out to be one of the best years in terms of player performance.


Imagine a world where the Detroit Red Wings are a good team. Imagine a world where modern analytics don’t exist. Yes, those two things were at one time both true. 2007-08 was a year to remember around the hockey world. Not only because young Alexander Ovechkin won the Hart trophy while going on an offensive rampage. A single-season performance that is almost unmatched over the last 12 years (which we will be diving into later in this article), but because this was the beginning of puck tracking, and analytics. The websites we have today (HockeyViz, Evolving-Hockey, NaturalStatTrick, etc..) would not be able to go as far back with their more modern analytics without the foundations built by Behind the Net and Hockey Analysis. We are fortunate enough to have access to every season dating back to 2007-08. Naturally, I became curious about the analytical production of the players back then. The results I found for the certain players caught me off guard, to say the least.
Derek Roy
The first question that most likely comes to your mind is, “which players put up these numbers?” There are some guys that even I did not expect to see when looking over the data. One shock being Derek Roy. In 2007-08 Roy was in his fourth year as an NHLer. He was drafted by the Buffalo Sabres in the second round at 32nd overall. In his ages 22 and 23 seasons, he totaled 109 points in 145 games played. Not bad for a second-rounder at that age. However, he only got better in 07-08. Not only did he put up a career-high in points (81) and goals (32), but with the development of analytics, it was clear his value was much higher than originally thought. He put up a 28.7 GAR (Goals Above Replacement) which is good for the sixth-highest all-time in the analytics era. Not only was his GAR high, but his xGAR (expected Goals Above Replacement) was high as well. At 26.9, he ranks 31st all-time among skaters in the category. Thanks to a good friend in HBF Analytics (@HBFAnalytica on Twitter, @HBF_Analytics on Instagram) we can view the player’s percentiles in the different categories in any given year since 2007-08.


As evidenced by the vizzes from both Evolving-Hockey and HBF_Analytics, it is clear that a ton of Roy’s value came from both his offensive output and quality chance generation. Despite his defense being around average, he was able to provide an exorbitant amount of offensive value. Enough to elevate his Goals Above Replacement to sixth all-time.
Marian Gaborik
Another name that might not be as recognized, or thought of when it comes to “bonkers individual seasons” is Marian Gaborik. A player that also hit a career-high in goals, and had one of his best seasons in points at 83. The only season where he bested that total was 2009-10, where he got three more assists. Despite the higher point total in 09-10, his value wasn’t as high. He managed a 25.2 GAR in only 76 games, which is good for 18th best all-time. Gaborik is another player that was atop the league in offensive impact while playing average defense. One interesting thing I found was the difference between his GAR and his xGAR. While Gaborik was 8th in GAR in 2007-08 and 18th all-time, he was 16th in xGAR over the same year span and 120th all-time. A discrepancy that large is interesting considering his shooting talent (Per Micah Blake McCurdy’s model) was the highest of his career at +9%. This would also be a good explanation for why he was so high in GF/60. He finished on a large number of his chances.
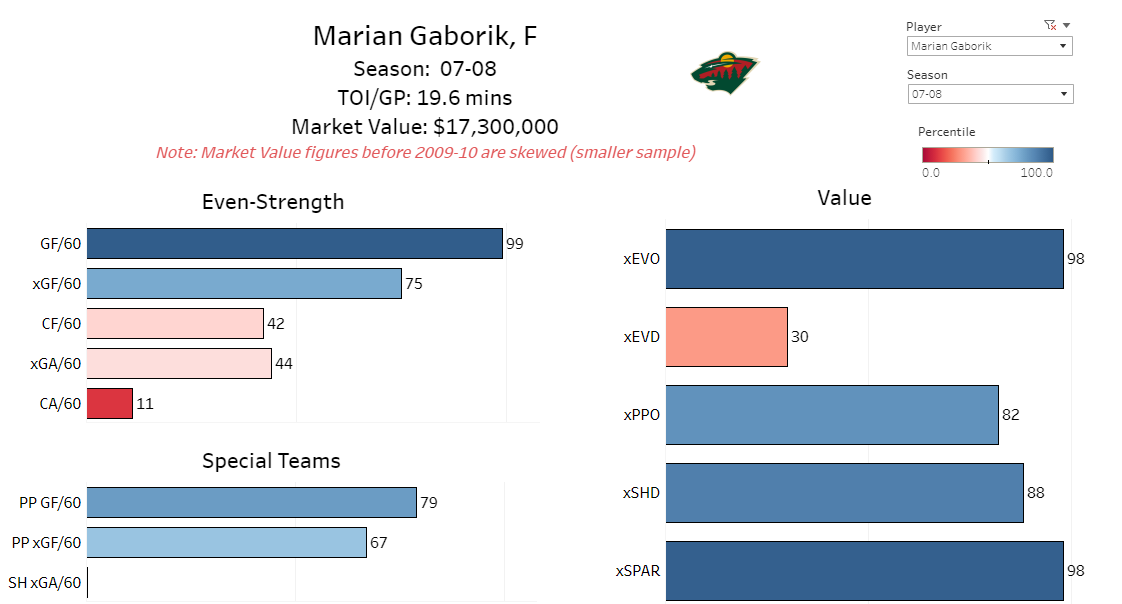

One trend that can be seen through these vizzes, is the clear contribution in GF/60 as previously mentioned. Arguably the most important category on any RAPM chart, the GF/60 category for both Roy and Gaborik are above three standard deviations. Both contributed to goals for their team in the 99th+ percentile. It is also a trend that can be seen with Hart trophy winners (or should have been Hart trophy winners *cough* Artemi Panarin *cough*) and finalists. Their GF/60 usually outweighs their xGF/60 and by a fairly large margin as well.
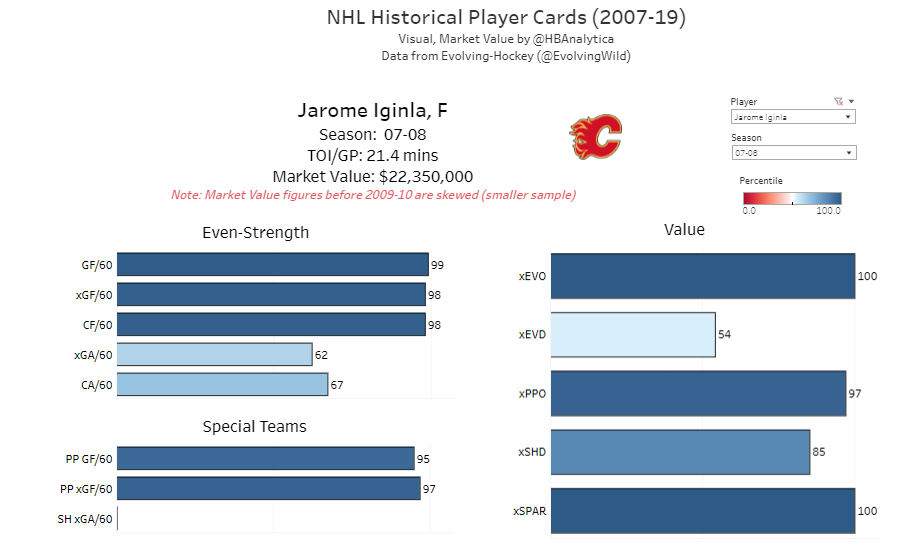
Jarome Iginla, Pavel Datsyuk, Alexander Ovechkin: The Holy Trinity
These three players not only helped revolutionize the game of hockey in their unique ways, but they were the main reasons why the analytics era started with a bang. The first of the three members of the holy trinity is Jarome Iginla. While Derek Roy had a higher impact in terms of GAR by a very slim margin (mainly because of his higher penalty GAR numbers) Iginla had the edge in xGAR and name recognition. I believe almost every hockey fan can come to the consensus that Iginla was one of the best players to ever lace up a pair of skates. Additionally, not only was he one of the best players, but also one of the most revolutionary players for the entire league. Jarome Arthur-Leigh Adekunle Tig Junior Elvis Iginla (for those that are unaware, yes this is his full name) consistently brought the hockey world to its feet with his dazzling two-way capabilities night in and night out.

In addition to Iginla, there is Pavel Datsyuk. Undoubtedly one of the best Red Wings, Russians, and two-way forwards of all time, Datsyuk murdered the league with his silky smooth-skating, his hands, and extremely high hockey IQ. It’s no wonder he was known as “The Magic Man.” Not only were his hands as smooth as high-quality fabric, but his ability to create chances off the rush because of his fantastic defensive play made him that much more of a threat. He could predict where the puck was going with ease. He almost always had his stick in the passing lane as well, which might have been the most impressive thing about his game, other than his otherworldly stickhandling. When Datsyuk was on the ice there were very limited options. He either had his stick in the way or was pickpocketing the guy with the puck before the chance to pass arose. There are countless clips of Datsyuk making a fantastic defensive play, breaking the puck out, and then scoring in transition. When he wasn’t doing that, he was driving play, and creating high-quality chances for his teammates. Whether that be from battles along the wall, or a crisp seam pass across the ice.
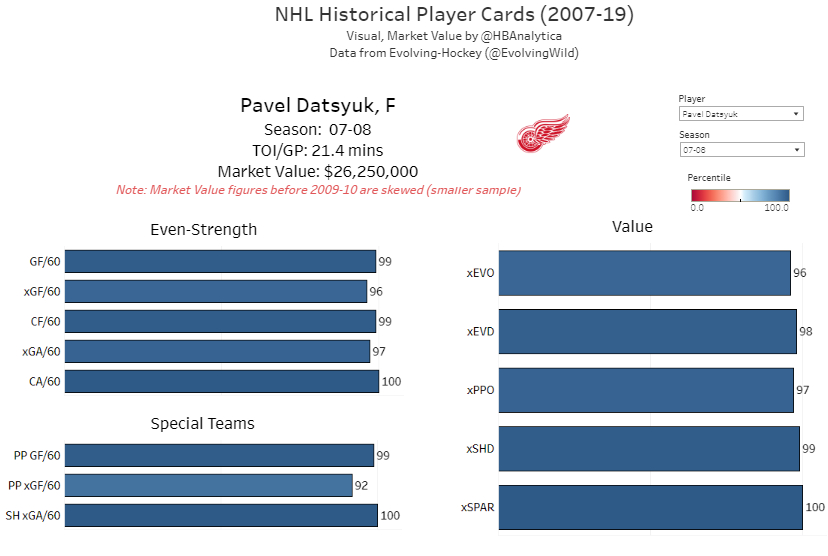
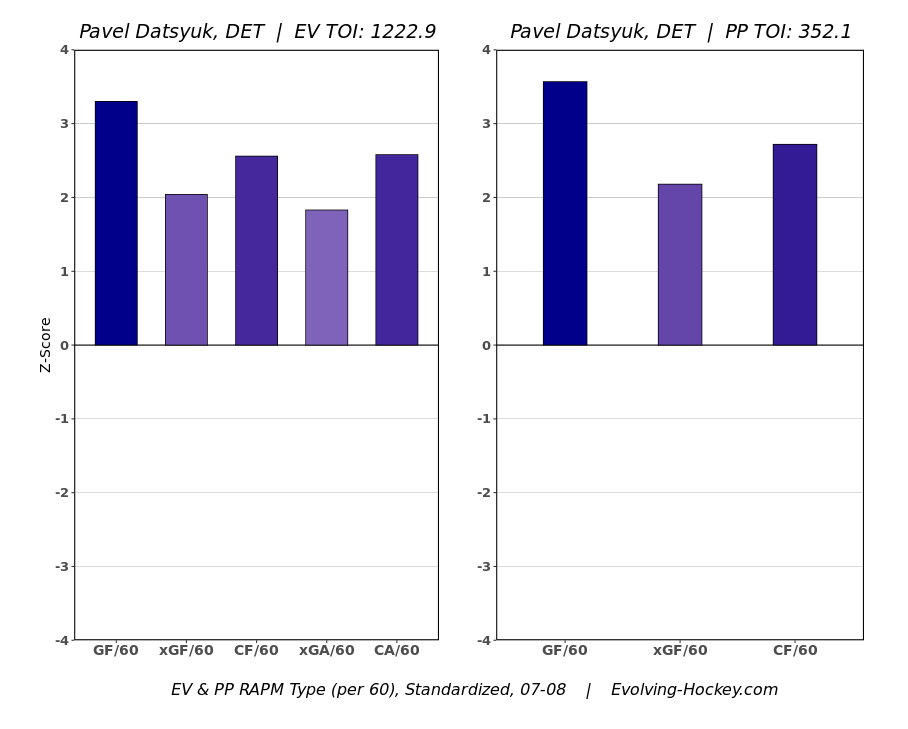
There was hardly ever a play where Datsyuk wasn’t involved on both ends of the ice. In 2007-08 Datsyuk had an MVP caliber season. He was first in GAR (and first all-time) with 40.6 (unreal), and third in xGAR (6th all-time) behind Alex Ovechkin and his teammate Henrik Zetterberg. For reference, in 2007-08 the next highest Goals Above Replacement after Datsyuk was Alex Ovechkin at 29.4. The consistency from “The Magic Man” was unquestionably one of his best traits. Not just in this one season, but over his career. He was always a threat and was always a reliable source of both offense and defense.
Before we continue, it needs to be known that Datsyuk did not make either of the all-NHL teams and was in 9th place in Hart voting. The best season ever in terms of analytical production was hardly recognized.
Branching from the topic of the Hart, it’s time we talk about the guy who won the award. Alexander Ovechkin at the age of 22 was a monster, to say the least. Ovi was one of the most culminating offensive forces in the entire NHL. He managed to notch career and league-high numbers in goals (the trend continues) and points with 65 and 112.
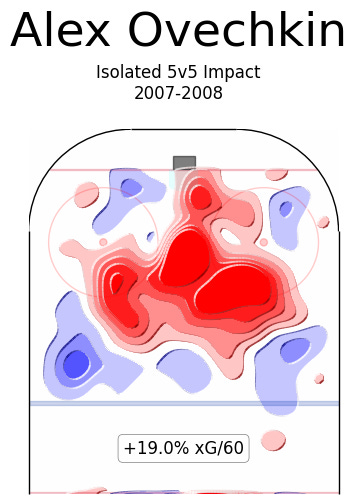
He produced from almost everywhere on the ice in terms of offense. Without a doubt one of the most versatile offensive players that season. Furthermore, one of the most productive offensive seasons in the history of the analytics era, and arguably the history of hockey.
His advanced numbers reflect the utter dominance he showcased too. Ovechkin was second in GAR that season, and places fifth all-time in the category. Also, his 07-08 campaign xGAR places first that year, and third among all-time seasons. As noted previously, the offense he displayed at that age was nothing short of elite. Despite the below-average defense, his overall value was not swayed. It was one of the most impressive seasons for any player to ever play the game in the analytics era, and most definitely Ovechkin’s best year of his career.


The Year of Extremes: Why?
Now we come to the most important part. Why do I call this particular season “the year of extremes”? The 2007-08 season was riddled with fantastic performances. There were plenty of guys that played extremely well by regular and advanced metrics that I didn’t cover. Players like Zdeno Chara, Henrik Zetterberg, Joe Thornton, Evgeni Malkin, Nicklas Backstrom, and Dany Heatley all performed at an extremely high level. One of the reasons why this particular season has the nickname it does is because of all of these aforementioned performances. The 07-08 season has half of the top 10 placements in GAR. It also has eight of the top 20. Moreover, it has exactly 10 of the top 50 best individual seasons dating up to 2019-20. When looking at xGAR it is a little less prominent but still impressive. Six of the top 20 placements were from the 07-08 campaign, and eight of the top 50 were as well.
No other year is this outstanding when it comes to top 20 individual season value placements. The closest in GAR being the 09-10 season, and the closest in xGAR being a tie between 08-09 and 09-10. However, that doesn’t even begin to scratch the surface. Three of the top ten all-time player seasons in RAPM GF/60 were from 07-08. Once again, no other year touches that total. The closest would once again be 09-10 with two. Finally, my favorite stat to come across during this research. The highest xGA/60 from that season and 14th best all-time was from none other than Jack Johnson. The next highest player was…Danny Briere. Two names that one wouldn’t normally think of when it comes to “spectacular defense and quality shot suppression.”
Despite all of these MVP caliber performances, the team aspect is not as exciting. The only top-five placement in any RAPM statistic is the Columbus Blue Jackets in xGA/60 placing fifth all-time. There are no top ten team GAR performances from this individual season, however, the 07-08 Red Wings did manage to place fourth all-time in team xGAR.
All this to say that the exciting seasons put up by individual players were not reflected in the team measures. Possibly suggesting that the player performances were THAT good, to the point where everyone else was slightly worse because of the dominance being shown. For example, both Datsyuk and Ovechkin had one other player on the team with 20+ GAR (9+ SPAR). For Datsyuk it was Zetterberg, and for Ovechkin it was Backstrom. This is not to say that the numbers for the other teammates were terrible by any means. Nicklas Lidstrom was quite close to breaking the 20 GAR barrier but wasn’t able to crack it with 19.8. Those teams had good seasons, but it is reasonable to assume that the utter dominance of Ovechkin, Backstrom, Datsyuk, and Zetterberg left little for the others to take.
Conclusion
The first season of the analytics era was the year of extreme feats. No other year in the time that analytics have been around had this many top tier performances. While the team aspect of “the year of extremes” is lacking, to say the least, that should not detract from the monstrosity that is the extremely high values of players from this particular season. Even if analytics aren’t your forte, the absurdity can still be seen through box score statistics. Not only do the stats portray this, but also watching the games do as well. After many hours of watching grainy and blurry footage, it is easy for me to conclude that the 07-08 season was one of the craziest and most awe-inspiring seasons we have ever seen. From versatile offense to fantastic two-way play, the 07-08 season will always hold a special place in my heart. As it should for any hockey fan wanting to gain more knowledge on some of the best hockey to ever have been played.